Baseball Esoterica

November 21, 2005

Schizo Streaks

So what's the most alternating wins and losses?

The most is 16, done twice since 1960. It was first done by the Phillies between June 3 and June 20, 1974. The ironic part is that after the "anti-streak", they went 20 games without a "one-game streak" (and nine games before it, as well!) Then the Dodgers did it, though it took them...two and a half months. Huh? Well, they happened to begin their streak on June 6, 1981, just five days before the two-month strike. When play continued on August 10, they picked up right where they left off, ripping off 11 more one-gamers through August 21. Now that's tough to do!

November 18, 2005

Upgrading...Be Back Soon

Hey all. Sorry for not posting. I am currently upgrading my systems so I don't have to say "I wonder if that's a record" quite as much. For example, I now have the ability to find the longest "schizo" streak, that is, the most alternating wins and losses. How many do you think? Leave a comment. Answer Monday...

November 11, 2005

The Great and the Ugly II - Range Rovers

Now let's look at the runs these guys surrendered this year. First here's where their ERA's wandered in 2005.

Season
ERA Range
Post-April
ERA Range
Lima 6.08 - 15.00 6.40 - 8.39
Milton 4.86 - 7.97 5.79 - 7.97
Clemens 0.32 - 1.89 1.10 - 1.89
Carpenter 1.29 - 7.84 2.21 - 4.24
    Here's a timeline of their season's progress. (Click to enlarge)


    • Yes, Clemens' ERA really never rose above 1.89 all season. It's unbelievable that he never even challenged that "2.00" line until very late in the season. Wonder if that's a record.
    • And, yes, Lima's ERA really never fell below 6.08 all season. It's unbelievable that he never really challenged that "6.00" line. That is definitely a record. It was as high as 8.39 twelve starts into the season on June 4.
    • Milton at least had a decent start. Between April 10 and 21, he actually had a better ERA than Carpenter!
    • Carpenter's ERA didn't stay below four until May 23, largely because of a disasterous three-inning eight-run start in April 10. If it weren't for that, he'd have been dipping below three at that point.
    • Oddly, all four pitchers displayed very similar patterns after the Break, steadily improving, and then fininshing poorly.
    Here's the earned runs (bottom axis) given up per start.


    Here's another way to look at it:

    0-1 2-4 5+
    Lima 4 14 14
    Milton 7 14 13
    Clemens 20 10 2
    Carpenter 14 15 4
    Some "wows" here.

    Lima allowed five of more runs 14 times, and Milton 13 times! Considering their average start was just over five innings, that is truly tragic. And, unsurprisingly, there was no shortage of "disaster starts"--those in which the pitcher allows more runs than innings pitched. Milton had 13 of them, an astonishing 38% of his starts. Lima wasn't far behind with 11 (34%). Both pitchers started seven games in which the opposing team finished with at least ten runs. I suppose there were money and reputation considerations, but it's hard to figure how you could keep sending these guys out there.

    Milton was the most Jeckyll and Hyde of the four, surrendering at least six runs ten times, but only allowing zero or one run seven times. Clemens was the most consistant. He didn't allow six runs in a start all season, and gave up only zero or one an amazing 63% of the time (20 of 32). In fact, he only gave up more than two runs five times all season! Now that's damn good.

    Next up, the rest.

    Extra Esoterica
    I meant to mention this in my last post when I discussed innings pitched. As you may know, Mark Buerhle ended a streak of 49 consecutive games of pitching at least six innings this past year. Well, Lima had the longest "non-Buerhle" streak of the four, and probably MLB when he went eight straight starts pitchingfewer than six between May 1 and June 9. All told, he went fewer than six in 21 of his 32 starts, as opposed to three of 33 for Carpenter.

    November 08, 2005

    The Great and the Ugly

    I'm sure many of you have tracked the seasons of two of 2005's best pitchers--Roger Clemens and Chris Carpenter--and two of the worst--Jose Lima and Eric Milton. I've tallied some interesting numbers from their performances this past season. First up, "Going Deep".

    The Great and the Ugly I - Going Deep

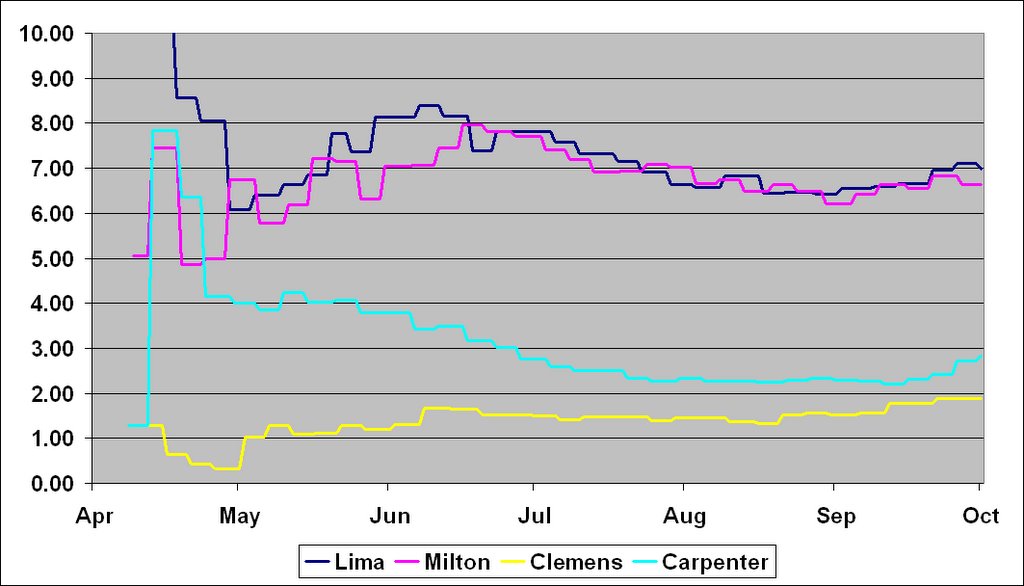
    Pitching deep into games is a good indicator of effectiveness. Check out how they match up.


    Inning Reached


    Starts 5 6 7 8 9 Comp IP
    Lima 32 23 16 6 3 1 1 168.2
    Milton 34 29 20 10 2 0 0 186.1
    Clemens 32 31 28 23 4 0 1 211.1
    Carpenter 33 31 31 26 17 8 7 241.2

    Lima Time didn't last very long in 2005. He made it past the fifth inning in only half of his starts, averaging a mere 5.27 per outing. He compiled only 168.2 innings despite 32 starts. That's the second-lowest total ever for a 32-start season with no relief appearances. Who beat him out? Steve Cooke made it through only 167.1 innings in 32 starts for the 1997 Pirates. Who did Lima bump out of second place in that category? Why, Eric Milton! In 1998, the rookie Milton pitched only 172.1 innings in 32 starts for the Twins. And the most innings in a 32-start season (since WWII)? Why, it's Roger Clemens! In the same number of games as Lima, he threw 246.2 innings for Boston in 1992. To add insult to injury, in the only start in which Lima made it to the ninth, a complete game 5-hitter on August 14, he still lost 1-0.

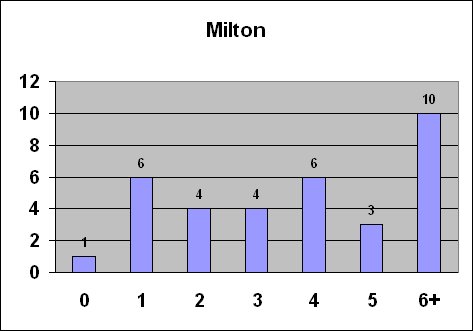
    Milton, on the other hand, did make a little history here, becoming the reigning king in the 34-plus start category of Not-Even-Coming-Close-To-Finishing-What-You-Started. Since 1900 there have been 743 seasons in which a pitcher has started at least 34 games without a relief appearance. Of those, only 11 have failed to log at least 200 innings in the process. And only one didn't make it to 195 . And then along came Milton, who, in blowing past the immortal Chuck Rainey, denies him his only claim-to-fame: an anemic 191 IP over 34 starts for the 1983 Cubs. Milton stomped all over Rainey with an even more unimpressive 186.1 IP. Who could have seen that coming? Well, actually, Milton narrowly escaped joining this club just last year, compiling only 201 innings in his 34 starts, good for 50th place in innings per start amongst 2004's 57 30-plus-game starters. But that didn't stop Cincinnati from giving him more than $25 million!

    Clemens was an interesting case. He had pretty good staying power, averaging 6.60 innings each time on the mound. But what makes that impressive--unbelievable, actually--is that he only got to the eighth four times! That's only one more time than Lima. He apparently had a predictable tiring point: he pitched exactly 7 innings in 19 of his 32 starts. Verrry interesting...

    Carpenter was the workhorse. He pitched 73 more innings than Lima despite making only one more start than him, and 55.1 innings more than Milton despite making one fewer start. He reached the eighth an amazing 25 times as opposed to Milton's...um...two. His 241.2 innings is the most in a 33-start, no relief season since Charles Nagy logged 252 IP in 1992. And Carpenter's 7.47 innings per start is the most since Randy Johnson's amazing 7.76 mark in his memorable 364-strikeout 1999 campaign.

    Tune in next time for some ERA fun.

    Extra Esoterica
    How about this for a contrast: In 1982, Bob Stanley averaged 3.51 innings per appearance in 48 games without a start. Yes, that's a record by far. He threw an amazing, only-topped-by-inhuman-Mike-Marshall 168.1 innings in relief, just about the same number as starter Lima. And each time out there, Lima, on average, got only 5 more outs than Stanley!

    November 01, 2005

    But Wait, There's More!

    Just because the season's over, doesn't mean that there's no more esoterica to discover! In the coming chilly months, I will wade through this year's stats and find many more inna-resting things that you never knew you never knew! Stay tuned.